 | Structural health monitoring with the MonoDAQ-E-gMeter MEMS accelerometer DAQ Unit7 February 2019 | Admin
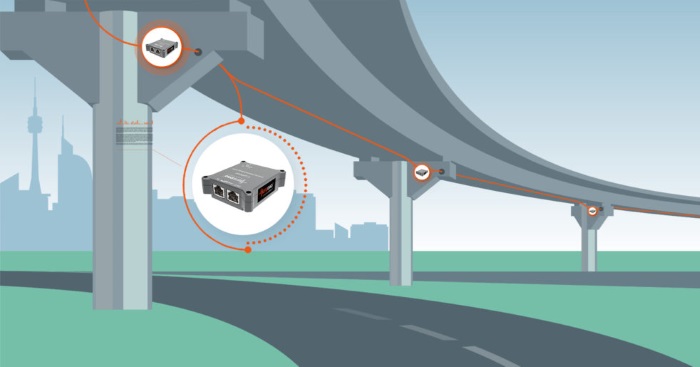
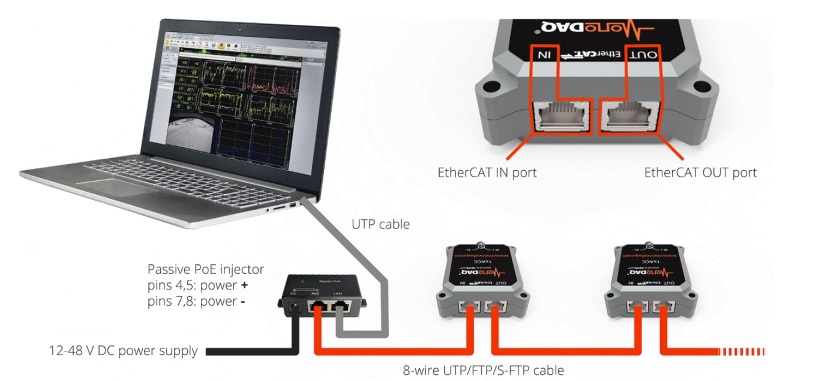
Structural health monitoring is an ongoing process of monitoring the mechanical state of structures. Disasters such as Genoa bridge collapse can be prevented using permanent structural health monitoring systems. Which parameters are measured?Low levels of vibration need to be measured which requires an accelerometer with extremely low noise. Even though low frequency is of interest, small changes in the frequency of vibration must be possible to detect. What equipment is used?Due to permanent monitoring requirements on many measurement points across the structure, the affordability of such a solution is extremely important. MEMS technology turns out to be mature enough at this point and an ideal choice for the demanding application. MonoDAQ-E-gMeter builds on the flexibility of the MonoDAQ-E product line (EtherCAT connectivity, 50 m module-to-module distance, single network cable, up to 48 V power supply, DEWESoft software) and includes a triaxial low-noise precision MEMS accelerometer that is comparable in performance to the special seismic accelerometers. Advanced engineering methods including signal filtering, integration to velocities and displacements, frequency domain analysis and complex statistics can be implemented inside DEWESoft software with low set-up effort and no special programming skills. The same is true for exporting to a database, 3rd party software format or sending the data using protocols such as OPC UA. What is the MonoDAQ-E-gMeterMonoDAQ-E-gMeter is an all-in-one sensor and a data acquisition device with a very low noise 3-axial MEMS accelerometer. The MonoDAQ-E-gMeter has an EtherCAT interface and DEWESoft software support. Power and signal over the same cable allows it to be distributed all over the structure that requires acceleration monitoring. Devices are daisy-chained using standard RJ45 cable.
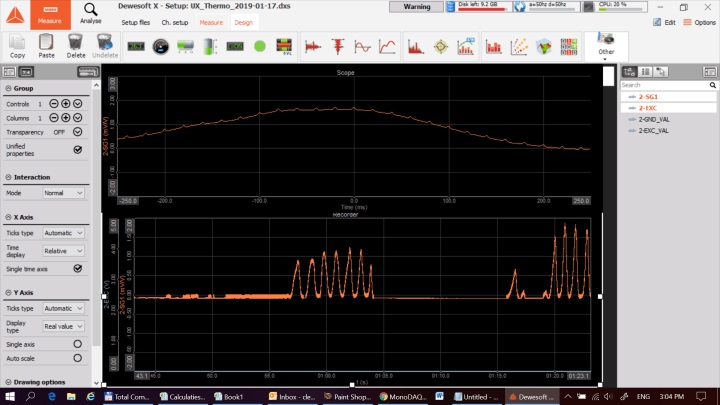
Software The MonoDAQ MonoDAQ-E-STG comes with a built-in LITE licence for DEWESoft, a powerful data acquisition, processing and visualization tool.
DEWESoft features all sorts of data analysis tools that can be used in real time on the incoming data. The user can design his/her own user interface with various graphs. All that is required are a few mouse clicks. If the predefined functions are not suitable, mathematical equations can be entered and executed as well. Data can be recorded and exported to all sorts of file formats to allow further analysis and treatment in the tool of your choice. Besides recording data DEWESoft can also record video allowing to visually link data to events. Features
|


